
Who's behind the news?
Who's behind the news?
Disaggregating federal dataset terminations from data-element removals
Updated and edited for clarity by the author, Oct 07 2026,.
ABSTRACT
This report analyzes dataindex.us's Federal Data Terminations Tracker (375 events since January 2025) to estimate impacts of federal dataset deletions and modifications. To do so, it applies a combination of computer assisted content analysis methodologies (Carlsen and Ralund 2022; Chang et al. 2026; Nielsen Garcia 2026). Contrary to prior reporting on the terminations, the corpus (dataindex.us) clearly distinguishes two event types: (1) 38 outright dataset terminations and (2) 337 partial data-element removals. These are not comparable events and collapsing them produces misleading claims about which domains and populations are most affected. Outright terminations concentrate disproportionately on federal education-related data, not health. Element removals concentrate in health-domain datasets, but are overwhelmingly driven by compliance with Executive Order 14168. The intentions and affected American constituents of the E.O. are clearly signaled by its title, “Defending Women From Gender Ideology Extremism and Restoring Biological Truth to the Federal Government”; The datasets themselves remain operational, and what is actually lost is their ability to see sexual- and gender-minority subpopulations. Data terminations themselves predominantly affect Research and Monitoring support functions, e.g. academic research and evaluation, policy development, and ongoing surveillance or risk assessment. Finally, more than half of the terminations represent the end of panel or timeseries collections that have been ongoing for several years, and a quarter of all terminations end long-term collection programs that have been running for over two decades.
METHOD
The methodological framework splits processing across two distinct sub-corpora:
The Element-Removal Corpus (n = 337): Characterized by high volume and highly repetitive regulatory justifications, such as standardized notices regarding demographic field removals under Executive Order 14168. This corpus was analyzed using the CALLMA framework (Nielsen Garcia, 2026), which combines dictionary and LLM classification methodologies applied to a human-derived thematic taxonomy grounded in close reading (Table 1).
The Dataset Termination Corpus (n = 38): Characterized by lower volume but diverse justifications for the terminations, spanning diverse agency rationale, and historical contexts. This corpus was processed using language-model-based classification (Chang et al., 2026) to generate an emergent typology of termination drivers (Table 2).
CALLMA classification was also applied to map downstream structural dependencies across two multi-label classification schemes:
Downstream Operational Functions: Terminated dataset descriptions were evaluated against an 11-category functional matrix (e.g., Surveillance & monitoring, Policy development & evaluation, Risk assessment) to measure specific institutional usage loss.
Affected Stakeholder Groups: Records were mapped to 16 distinct user communities (e.g., Research & analysis, State, local & tribal government, Industry & employers) to measure the breadth of external dependency.
Classifier | Average | Precision | Recall | F1-score | Support |
CALLMA (element removals) | micro | 0.98 | 0.90 | 0.94 | 60 |
CALLMA (element removals) | macro | 0.74 | 0.71 | 0.73 | 60 |
CALLMA (element removals) | weighted | 0.95 | 0.90 | 0.92 | 60 |
CALLMA (element removals) | samples | 0.98 | 0.90 | 0.93 | 60 |
Chang (terminations) | micro | 0.90 | 0.81 | 0.85 | 32 |
Chang (terminations) | macro | 0.72 | 0.70 | 0.69 | 32 |
Chang (terminations) | weighted | 0.93 | 0.81 | 0.85 | 32 |
Chang (terminations) | samples | 0.90 | 0.85 | 0.87 | 32 |
Table 1. Classifier validation performance (global averages) against human-corrected gold samples: CALM round-2 held-out (60 label instances) and the Chang-informed close-reading classification (32 label instances, 10-dataset sample).
FINDINGS
1. Disaggregating terminations from element removals
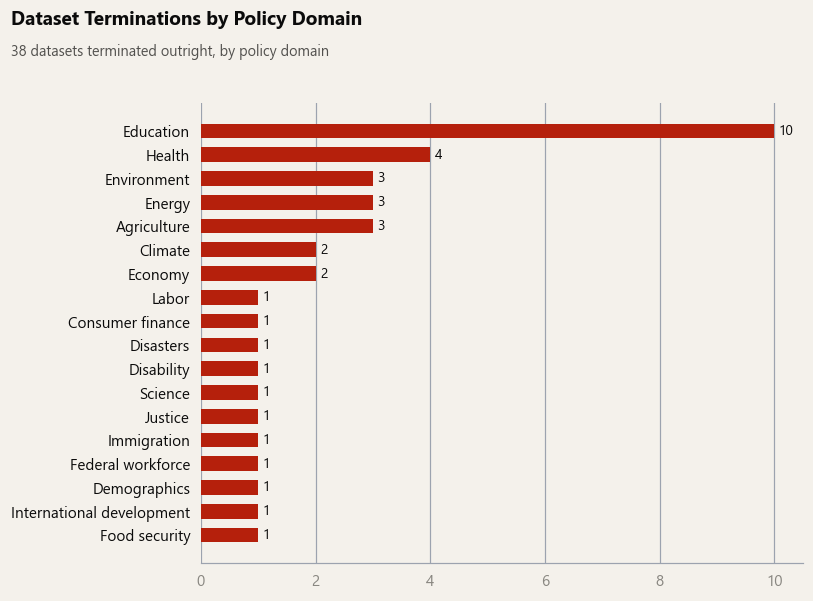
Figure 1a. terminated datasets (n=38) by policy domain
The tracker's Section field separates complete terminated datasets from partial reductions (data element removals). The two are not comparable in severity or in which domain they concentrate in. Clearly one Dataset Termination, defined as “the outright cancellation, complete discontinuation, or full sunsetting of a data collection program, survey, report series, or public database” (dataindex.us 2026) and one data element removal, respectively defined as “a modification where an underlying dataset or survey continues, but specific variables, fields, sub-tables, questions, or sensitive categories are removed, suppressed, or stripped from public release.” (ibid), are not the same.
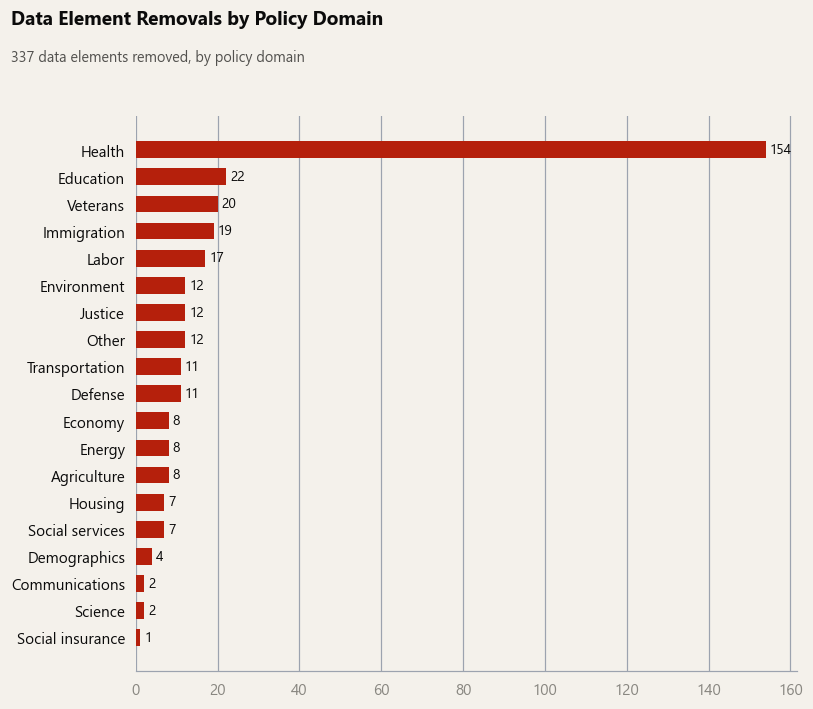
Figure 1b. partial reductions data elements removed (n=337) by policy domain
The suggestion that health has been most affected (Qin and Pessoa 2026; Staff 2026) seems to have been based on the aggregation of data element removals and dataset terminations. However, even at first glance, the subset of data element removals within datasets terminated would reveal a more comparable number. For example, using the same definition that dataindex.us, for one of the datasets Producer Price Index (PPI), approximately 350 series data elements were removed while their respective parent data products continued (Bureau of Labor Statistics 2025).
Even accounting for the many data elements that a dataset contains, however, is quite limited in its representation of the information loss that goes into these deletions. “Data” is a broad term, and the deployment of data (Borgman 2015) as well as the stakeholders and systems that said data represents is what impacts infrastructure. A more realistic recognition of their inequivalence needs to consider the social life that these data elements intend to represent, as well as the institutions and actors that leveraged these "data" or facts. Take the data element categories of gender and income class as an example. The perceived information loss from the removal of each of these “data elements” is unlikely to feel “uniform” depending on whether you ask a predominantly queer upper-middle income household, or a predominantly CIS household that is below the poverty line. The full analysis of the impacts of such an info loss are exhaustive and cannot be compressed into a research report, but content analysis of what was deleted and who was affected can begin to disentangle these impacts. While this report provides the macro perspective, Morgan Kriesel’s journalistic fieldwork[1] can serve as a further resource for readers seeking a granular, micro-level look into specific examples of these downstream implications.
2. Content analysis: what kind of data elements were lost
Health leads Fig. 2's raw count of element removals. Applying CALLMA to the full 337-row corpus (Fig. 2, above) shows the following decomposition of data element removals.
Label | N (of 337) | % |
continuity_maintained | 315 | 93% |
gender_item_removed | 249 | 74% |
no_removal_evidenced | 11 | 3% |
COVID | 5 | 1% |
no_notice | 3 | 1% |
unclassified | 3 | 1% |
lower_paperwork | 2 | 1% |
Table 1. full-corpus labels across all 337 element removals (multi-label; rows can carry more than one tag). Classified per CALLMA (Nielsen Garcia, 2026).
The Health-domain concentration in Fig. 1B is potentially misleading on its own. The dominant driver (74%) is compliance with Executive Order 14168, which is not strictly a health-policy-related action. Executive Order 14168, as made clear by its title, sets out to “Defending Women From Gender Ideology Extremism and Restoring Biological Truth to the Federal Government” (Federal Register 2025). Ultimately, this is better read as a targeted representation of how the federal data ecosystem tracks sex and gender identity, surfacing as “Health” largely because health surveys happen to ask the most demographic questions, not because health data specifically was the target.
3. Dataset terminations
Restricting to the 38 outright terminations (Fig. 1A, above): why did they happen? Close-reading each record and sorting into emergent categories (CALLMA's language-model-based pass) gives:
Category | N | % |
Recurring series/panel discontinued (prior data stands) | 22 | 58% |
Sub-component of a still-continuing system | 5 | 13% |
Tool or portal taken down | 4 | 11% |
Collected but withheld / not released | 4 | 11% |
Proposed, not yet final | 2 | 5% |
Pilot ended before a recurring baseline existed | 1 | 3% |
Table 2. Why terminations happened: an emergent typology (n=38).
Most terminations are not wholesale deletions; rather, they occur when a recurring survey, longitudinal cohort, or periodic report loses its next wave while prior data remains available. The longer a panel study continues with recurring collection and updates, the more reliably it can evaluate trends.
Additionally, over time, an institutional recurring collection can recruit more stakeholders, institutions, and resources. As more institutional participants come to rely on its regularly updated information and the breadth of its historical perspective, the asset develops a sort of gravity. Because it attracts increasing dependencies, its overall institutional value grows.
Thus, the fact that many dataset terminations affect panel or recurring time-series collections that have lasted decades represents a compounding loss of information. As time passes, more individuals, institutions, and systems come to depend on that asset. Consequently, the termination of older dataset collections grows increasingly costly over time.
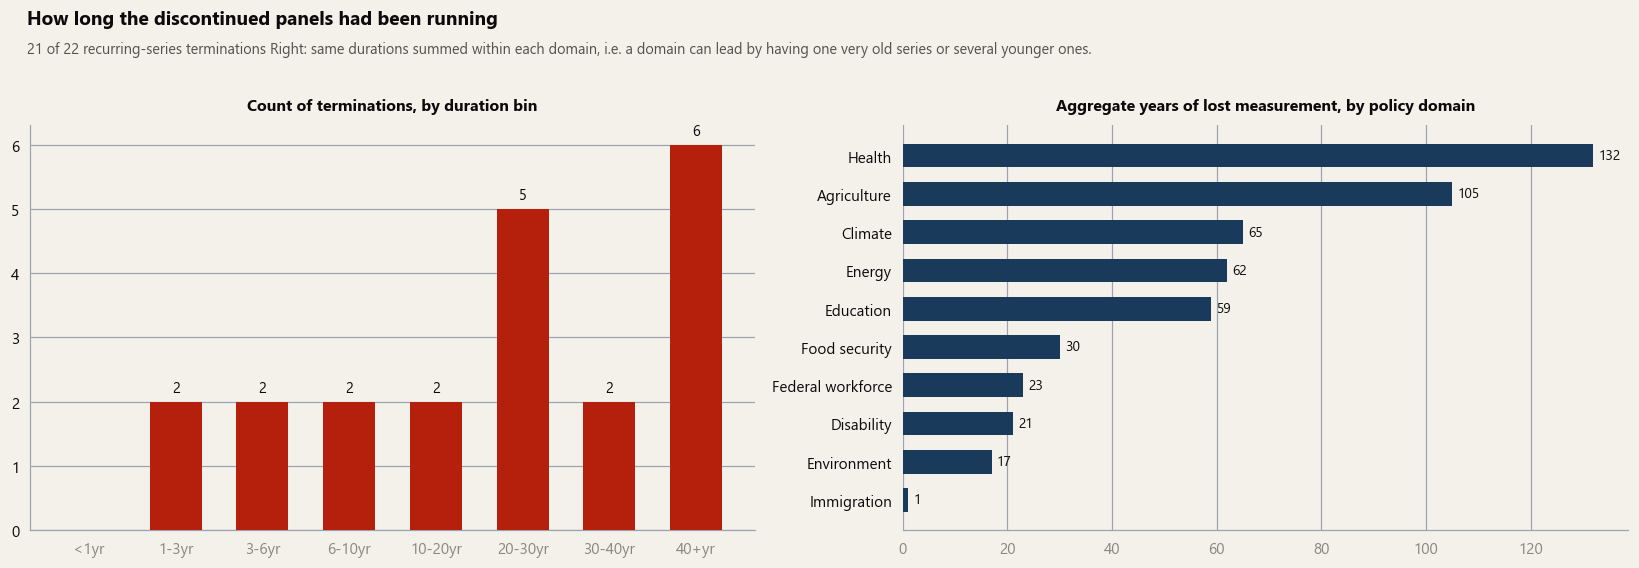
Figure 2: Duration and cumulative history of discontinued recurring panels (n=21 of 22)
Among 21 of the 22 recurring-series terminations in the documented DataIndex cases for which a defensible start year could be established, most affected programs were longstanding. Thirteen of the 21 had existed for at least 20 years, including six with histories of 40 years or more. These durations represent the span from the first documented series or cohort year to termination and do not necessarily imply uninterrupted annual operation. When these durations are aggregated across policy domains, the cumulative loss of historical measurement is most severe in health, which accounts for 132 aggregate years of lost monitoring, followed closely by agriculture with 105 years.
4. Downstream function impact
An alternative signal of affected parties comes from analyzing downstream functions. By classifying downstream functional capacities within the descriptions of terminated datasets, we can measure the specific ways in which these data were being used and evaluate how frequently key usages, like research and evaluation, were leveraging each asset.
To do this each terminated dataset is classified against 11 standardized downstream-use functions:
Function | Definition |
Research & evaluation | Academic, scientific, or program evaluation |
Policy development & evaluation | Designing, monitoring, or evaluating policy |
Program administration | Operating or administering government programs |
Surveillance & monitoring | Repeatedly tracking social, health, environmental, educational, or economic conditions |
Planning & resource allocation | Deciding where resources, services, or infrastructure are needed |
Regulatory enforcement | Supporting regulation, compliance, investigations, or enforcement |
Risk assessment | Estimating current or future risks |
Market & business decisions | Pricing, contracting, investment, or industry planning |
Public transparency & accountability | Enabling external oversight of government or institutions |
Workforce management | Hiring, staffing, compensation, or workplace management |
International benchmarking | Comparing U.S. outcomes with other countries |
Table 3. Downstream Function Taxonomy for Dataset Terminations
When disaggregated by downstream functional impact, the domain profile of dataset terminations shifts dramatically from raw element-removal counts. As illustrated in Figure 3, Education accounts for by far the highest total number of affected downstream-function instances (30 instances), more than double that of Health (14 instances), followed by Environment (10), Energy (10), and Agriculture (9).
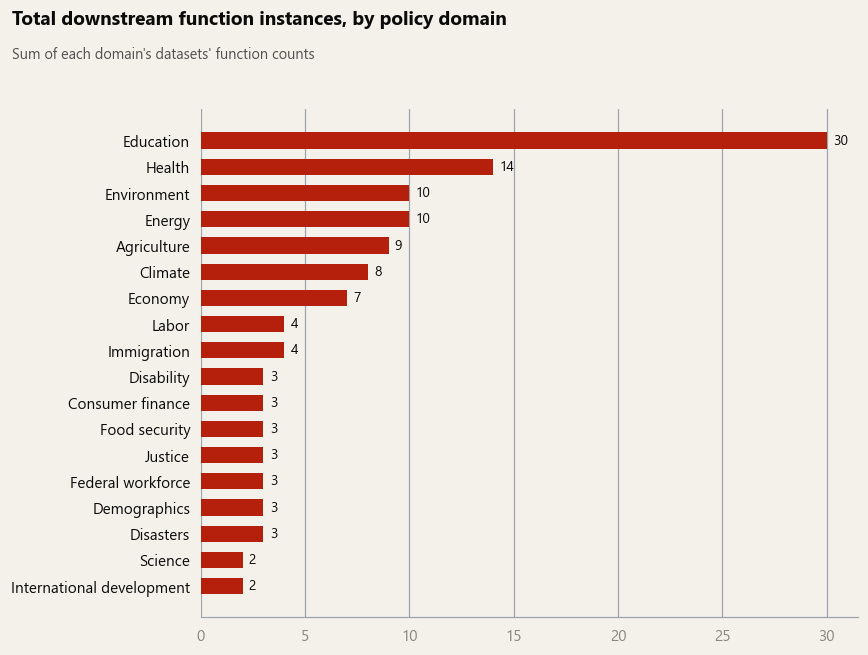
Figure 3. Total downstream-function instances affected, by policy domain (sum across each domain's terminated datasets).
Examining the distribution of specific downstream functions across the top six domains reveals distinct operational vulnerabilities (Figure 4). Across the primary social domains, Policy development & evaluation and Research & evaluation represent the dominant functions supported by terminated datasets. In Education (n=10), this reliance is nearly complete: every terminated dataset supported policy development and evaluation (10/10), while nine out of ten supported academic or scientific research (9/10). Health (n=4) displays a similar dependence on core governance and analytical capacities, led equally by policy development (4/4) and surveillance and monitoring (4/4), alongside research and evaluation (3/4).
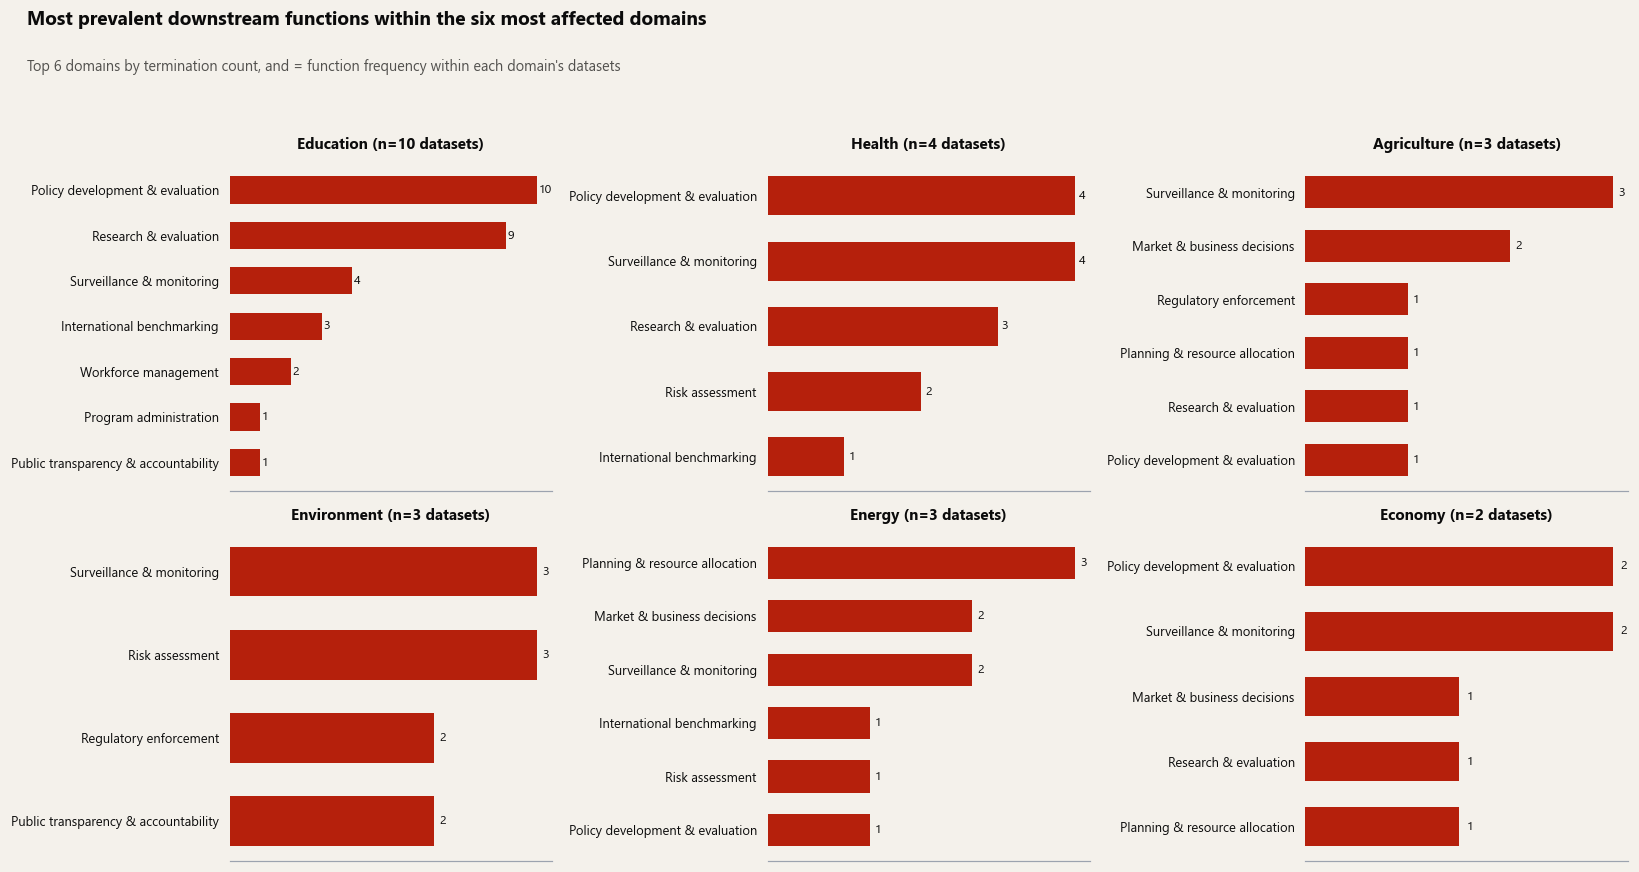
Figure 4. Most prevalent downstream functions within the most-affected domains (top 6 by termination count).
In contrast, non-social policy domains exhibit distinct functional loss profiles tailored to their specific operational mandates. In Environment (n=3) and Energy (n=3), function loss shifts away from academic research toward regulatory, risk, and resource planning capacities. All environmental terminations (3/3) supported ongoing surveillance and risk assessment, while energy terminations primarily disrupted planning and resource allocation (3/3) alongside market and business decisions (2/3). Similarly, terminated agricultural datasets (n=3) predominantly served surveillance and monitoring (3/3) and market decisions (2/3). Rather than representing generic administrative trimming, dataset terminations structurally undercut the distinct policy formulation, scientific research, and market-planning functions unique to each domain.
A stakeholder-level view of these terminations, considering which stakeholder groups are most affected, and by which downstream functions, was explored during the HITL LLM coding (Chang et al. 2026), and is presented in the Appendix. It has not been independently validated via human coding and is offered as a corroborating perspective, not a primary finding.
Implications & Future Work
Two distinct harms run in parallel and call for different remedies. Terminations are an infrastructure and data continuity problem concentrated in federal education statistics, where longitudinal cohorts and recurring surveys have lost their next wave while prior data stands. Element removals are a visibility problem concentrated in Executive Order 14168 compliance. Sexual- and gender-minority populations specifically lose the ability to be identified within data that otherwise keeps flowing to everyone else. A single “ datasets affected” count, or a raw per-domain aggregate, obscures both of these distinct structural dynamics.
Recognizing terminations as an infrastructure loss directly highlights the need to understand how data dependencies compound over time. Building on the premise that longstanding collections accrue institutional gravity, future work should empirically examine whether stakeholders across these policy domains agree that longer-running recurring series carry greater institutional dependencies and higher costs of loss. Investigating how user communities adapt to, or mitigate, these broken longitudinal baselines will further clarify the true long-term costs of federal data infrastructure disruptions.
Overall, the impact of federal data actions cannot be reduced to a single headline metric. Outright dataset terminations represent an infrastructure loss concentrated primarily within federal educational statistics infrastructure rather than health. Perhaps more concretely, it paints a more complicated than just Health or Education were most hit – they were affected in different ways. Education seems to have suffered some of the most wide-ranging terminations of statistical and monitoring instruments and functions. Health, and the data element removals concentrated in it, show a clear record of a very specific intention to modify how the Federal Government counts, or sees, its constituents. Even according to their own stated objectives, removing categories like self-reported gender identity is a short-sighted policy win. It might sell well as a government marketing trick to sound tough on TV, but it just leaves federal and private info professionals operating in the blind. Regardless of whether your goal is to support these groups or monitor them, erasing this self-reported data is entirely counterproductive.
Bibliography
Borgman, Christine L. 2015. Big Data, Little Data, No Data: Scholarship in the Networked World. The MIT Press. https://doi.org/10.7551/mitpress/9963.001.0001.
Bureau of Labor Statistics. 2025. “BLS to Discontinue Selected PPIs.” Bureau of Labor Statistics. https://www.bls.gov/ppi/notices/2025/bls-to-discontinue-selected-ppis.htm.
Carlsen, Hjalmar Bang, and Snorre Ralund. 2022. “Computational Grounded Theory Revisited: From Computer-Led to Computer-Assisted Text Analysis.” Big Data & Society 9 (1): 20539517221080146. https://doi.org/10.1177/20539517221080146.
Chang, Tien-Chih, Alice R. P. Li, Chia-Yu Wang, and John J. H. Lin. 2026. “From Automation to Thinking: The Role of AGI in Discourse Analysis of Computer-Supported Collaborative Learning Based on Computational Grounded Theory.” Computers & Education 247 (July): 105579. https://doi.org/10.1016/j.compedu.2026.105579.
Dataindex.Us. 2026. “Federal Data Terminations Tracker.” August 17. https://dataindex.us/terminations-tracker.
Federal Register. 2025. “Defending Women From Gender Ideology Extremism and Restoring Biological Truth to the Federal Government.” January 30. https://www.federalregister.gov/documents/2025/01/30/2025-02090/defending-women-from-gender-ideology-extremism-and-restoring-biological-truth-to-the-federal.
Nielsen Garcia, Christian. 2026. “Conditionally Assigned Large Language Model Analysis (CALLMA): Revising AI Content Analysis Through Socio-Technical Grounded Theory.” Unpublished manuscript.
Qin, Amy, and Flávio Pessoa. 2026. “Trump 2.0 Has Deleted or Altered Nearly 400 US Datasets, Endangering Public Health, Education and More.” US News. The Guardian, August 18. https://www.theguardian.com/us-news/ng-interactive/2026/aug/18/trump-federal-data-deleted-altered.
Staff, Global Biodefense. 2026. “Federal Health Data Takes Biggest Hit as Trump Administration Purges Nearly 400 Government Datasets.” Global Biodefense, August 18. https://globalbiodefense.com/2026/08/18/federal-health-data-takes-biggest-hit-as-trump-administration-purges-nearly-400-government-datasets/.
APPENDIX
A. Stakeholder Impact
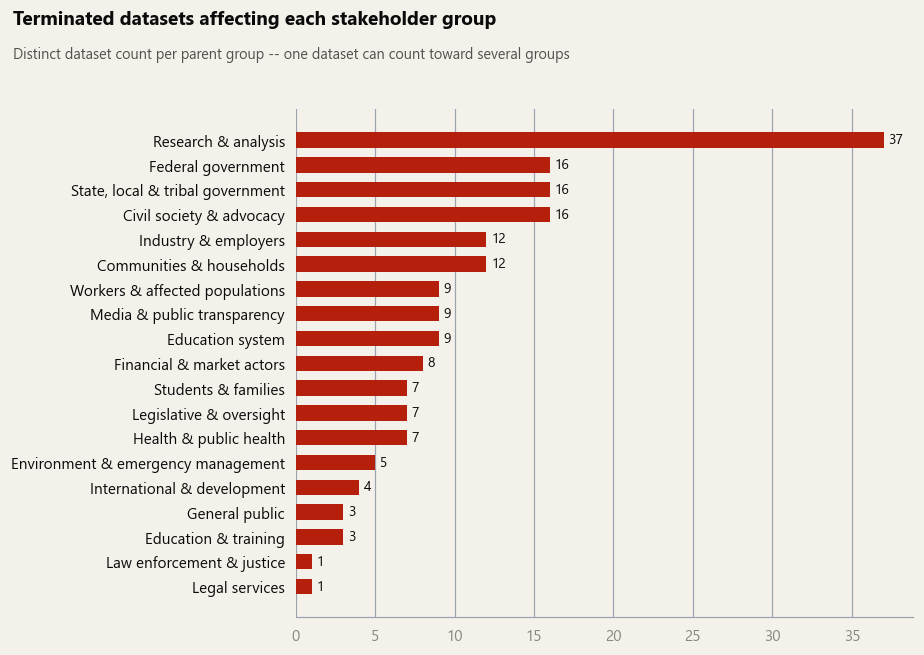
Figure 5. Terminated datasets affecting each stakeholder group (distinct dataset count per parent group).
Mapping terminated datasets to their affected user communities demonstrates that information loss extends far beyond academic institutions. As shown in Figure 5, Research & analysis represents a nearly universal baseline of disruption, linking to 37 of the 38 terminated datasets. However, the downstream impacts concentrate heavily across institutional governance, public interest advocacy, and economic sectors.
Beyond scientific and policy analysts, the affected stakeholders cluster into three distinct institutional pillars, each linked to 16 terminated datasets: Federal government, State, local & tribal government, and Civil society & advocacy. This distribution underscores that dataset terminations do not merely affect external observers; they directly handicap intra-governmental operations, inter-governmental resource coordination, and public accountability mechanisms. Following these core administrative groups, Industry & employers (n = 12) and Communities & households (n = 12) represent the primary economic and civic sectors bearing the burden of lost data
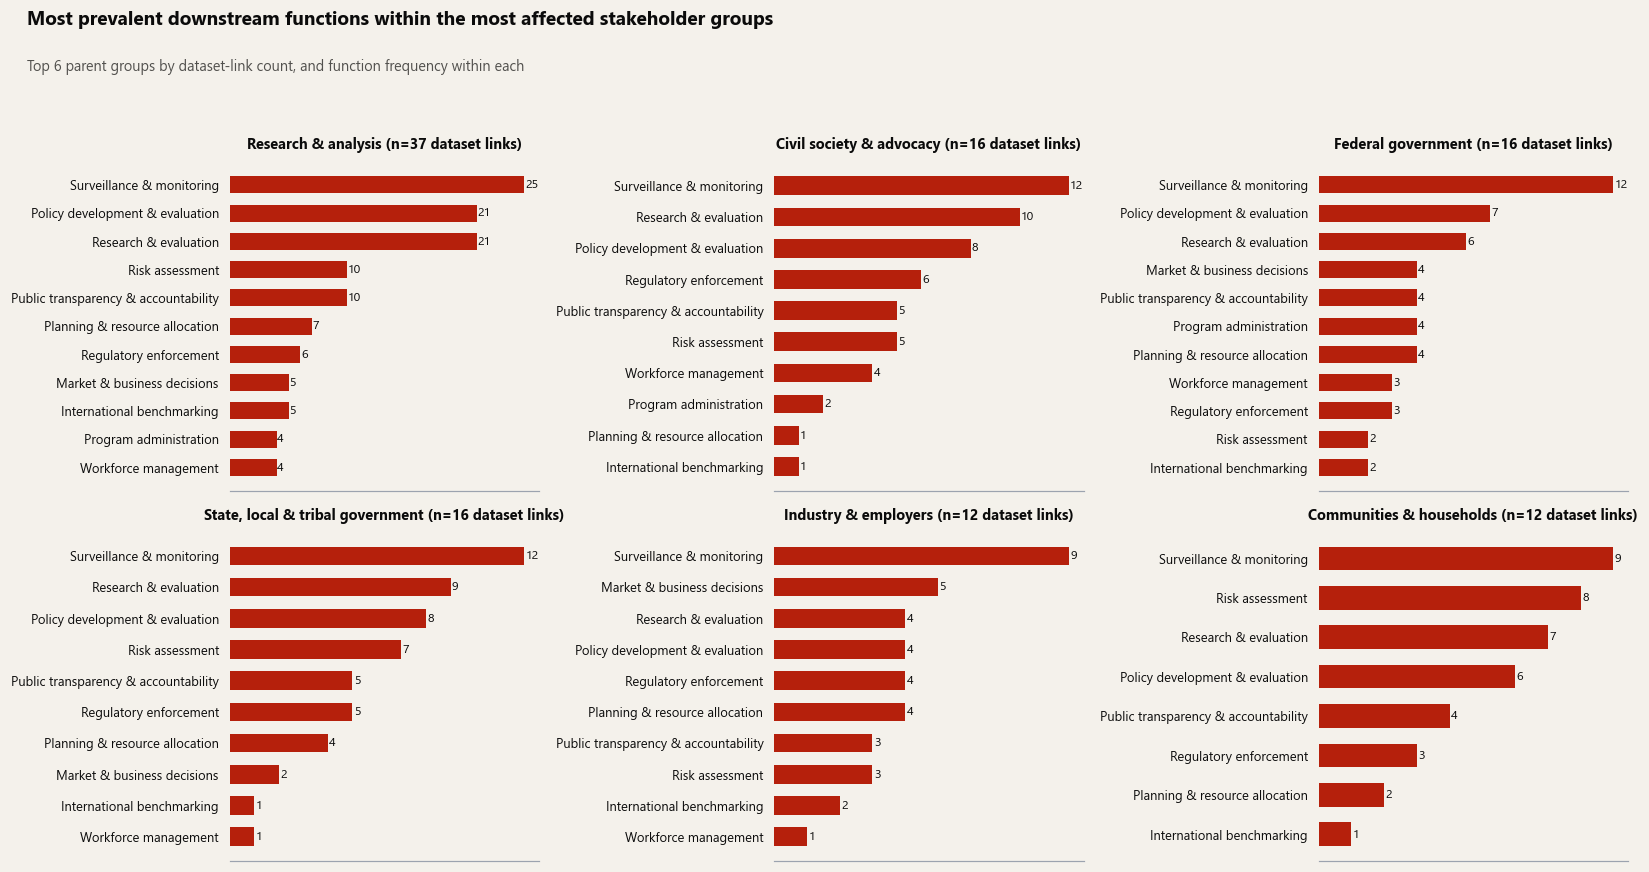
Figure 6. Most prevalent downstream functions within the most-affected stakeholder groups (top 6 by dataset-link count).
Examining the functional cross-section of these primary stakeholder groups (Figure 6) clarifies why these disruptions occur. Across every top stakeholder category, Surveillance & monitoring emerges as the dominant lost function—accounting for 25 dataset links within Research & analysis, 12 links each for Federal government, State/local/tribal government, and Civil society, and 9 links each for Industry and Communities. For public sector and advocacy actors, this loss translates to a diminished capacity for early-warning detection, longitudinal trend analysis, and evidence-based policy formulation. For community actors and industry stakeholders, the loss centers on Risk assessment (n = 8) and Market & business decisions (n = 5), removing standardized baselines necessary for localized planning, private investment, and economic forecasting.
§
Read the Prairie Fire newsletter for further analysis of this report.
Original work by Christian Nielsen Garcia, for Dharma Road, Inc. First published by Newsjunkie.net. This work is licensed under a Creative Commons Attribution-NonCommercial 4.0 International License CC BY-NC 4.0.
Permitted Use: You are free to share, copy, and redistribute this material in any medium or format, provided you give appropriate credit to the original creators and do not use the material for commercial purposes.
Permissions Beyond Scope: For academic, news journal, or commercial republication permissions beyond the scope of this license, please contact editor@newsjunkie.net.
People or organizations mentioned in this research that are in our database.
Virtual
dataindex.us is a collaborative effort dedicated to monitoring changes in federal datasets. Its team is building tools to track a broad range of changes in federal datasets to build actionable insights for policymakers, advocates, journalists, and data users.